This is a narrative article, written by Barry Revzin.
I took some time to look at the World Record progressions in all of the modern long course meter events. It’s the most complete data set that I has ready access to and there’s a lot of interesting data in there begging to be visualized.
A good place to start is – just how often are world records broken? How many times has it happened? Here is a chart of the number of records by year since the start of official tracking.
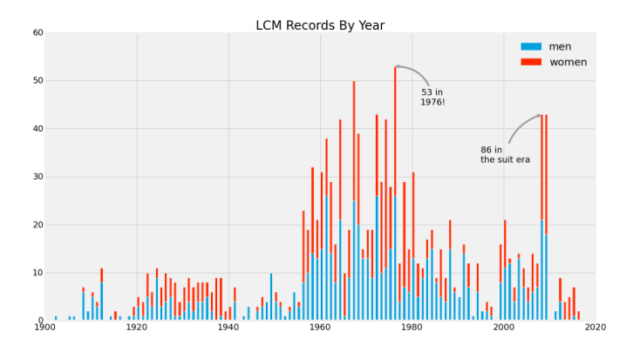
I knew going in that 2008-2009 would be a large outlier. However I definitely did not expect to see such a large peak in 1976, or 1967, or why there was such a noticeable and prolonged explosion of records from 1956 through the 1980s.
These are questions that probably lead to interesting answers. But first, simply looking at the number of world records broken in a year is a little skewed. Not all world records are equal – Paul Biedermann breaking Ian Thorpe‘s 400 free record by 0.01 isn’t quite the same as his breaking Michael Phelps‘ 200 free record by nearly a full second in a much shorter race. So let’s scale the records by the percent improvement and see what we get:
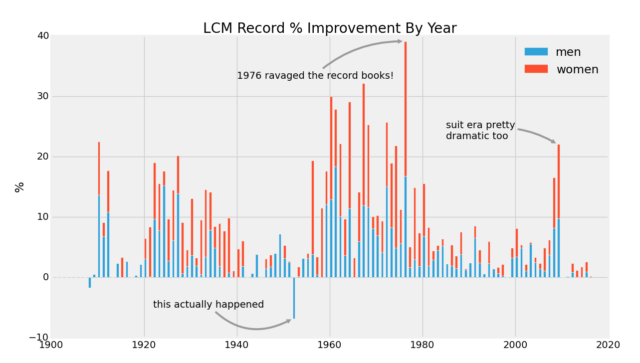
If anything, scaled appropriately both the 1976 peak and the 2008-2009 suit era look even more outlandish. It’s easy to see how much time was dropped from the record books in such a short time period compared to the two decades prior.
What I find especially fascinating about this graph is the surprise negative peak in 1952.
Indeed, sometimes records do go backwards when rules change (in this case, when breaststroke was no longer allowed to be butterfly). I’ll have more to say about the men’s 200 breaststroke in a future email. Here on out, I will ignore all world records that ended up being nullified later to make sure that all the records get strictly better with time.
How can we compare world records to each other? Or, more broadly, different swimmers’ impacts on their events? One way is to simply look at how much time that swimmer has dropped over the course of their record breaking.
Katie Ledecky has broken the world record in the 800 free four times (for now), but rather than look at each break separately, it makes more sense to simply state that she has reduced the record from 8:14.10 to 8:06.68, for a total drop of 1.50%.
In some events, multiple swimmers traded the record between them. In these cases, I am always looking at the last time before a swimmer had the record and comparing that to the last time that the swimmer had the record (e.g. I am considering Michael Phelps as having lowered the 100 fly record from 51.76 to 49.82, even though Ian Crocker and Milorad Cavic broke the record 4 times between them in the middle).
With all of that in mind, there are 12 cases since 1976 of a swimmer dropping at least 3% off of a record. They are:
| Drop | Swimmer | Event | From | To | Year |
| 4.81% | Joe Bottom | 50 Free | 23.86 | 22.71 | 1980 |
| 3.75% | Michael Phelps | 100 Fly | 51.76 | 49.82 | 2009 |
| 3.41% | Aaron Peirsol | 200 Back | 1:55.87 | 1:51.92 | 2009 |
| 3.33% | Michael Phelps | 200 IM | 1:58.16 | 1:54.23 | 2008 |
| 3.32% | Ulrike Tauber | 200 IM | 2:20.51 | 2:15.85 | 1977 |
| 3.24% | Lina Kachushite | 200 Breast | 2:33.32 | 2:28.36 | 1979 |
| 3.19% | Michael Phelps | 200 Fly | 1:55.18 | 1:51.51 | 2009 |
| 3.15% | Tom Jager | 50 Free | 22.52 | 21.81 | 1990 |
| 3.15% | Michael Phelps | 400 IM | 4:11.76 | 4:03.84 | 2008 |
| 3.14% | Federica Pellegrini | 200 Free | 1:56.64 | 1:52.98 | 2009 |
| 3.10% | Aaron Peirsol | 100 Back | 53.60 | 51.94 | 2009 |
| 3.01% | Mary T. Meagher | 200 Fly | 2:09.87 | 2:05.96 | 1981 |
Add another to list of Michael Phelps superlatives – he’s on here four times! Notably, of the 12 cases, 7 are from the suit era (indicated in bold). Keep in mind that these are only for records broken after 1976, as that year was a game changer for the swimming record books.
Including all of history, we have ten instances of a swimmer dropping more then seven percent off of the previous world record, led by Arne Borg (13.09% in the 1500 by 1927 and 7.67% in the 400 by 1925) and Dawn Fraser (8.82% in the 100 free by 1964 and 7.13% in the 200 free by 1960). Also worth noting, the original distance freestyle queen: Ragnhild Hveger from the mid 1930s to the early 1940s held the world records in the 200/400/800/1500 freestyles (dropping 2+, 5+, 6+, and 7+% in them respectively) and even the 200 back (dropping 1.85%).
This is all world records in the past. What can we say about world records in the future? Let’s take a look at the 100 free world record progression:
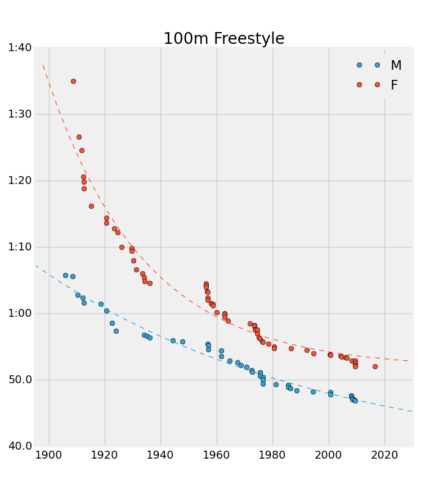
As we can see from this plot, while the world record keeps improving over time, the amount of improvement gets progressively smaller and smaller. The curves look very similar to exponential decay. The exponential curves (indicated by the dotted lines) give a remarkably good fit to these progresses. The proportion of variance explained by this model (the R-squared) is 97.2% for the men and 94.9% for the women.
If we projected forward to Rio, this model would guess that the world record would be 46.37 for the men and 53.31 for the women. The former would likely be the swim of the meet, while the latter may not even medal! No model is perfect.
But the high R-squared isn’t enough of itself to suggest that this is a good model. Just looking at the plot, it looks like there’s a little more going on. Something changed in the 1950s that had a profound impact on the 100 freestyle, both men and women: the introduction of the flip turn in the 1956 Olympics!
So it make sense to divide our history into two different periods and do two different fits:

As we can see, the dotted line fits match the data much better. The new R-squared are higher (98.5% for the men and 98.0% for the women), as are the predictions for Rio: 46.92 for the men and 52.48 for the women. The men’s record is basically on the dot, the women’s didn’t quite keep up with Britta Steffen and Cate Campbell. But it does get into the 51s pretty quick!
Doing a double exponential fit sometimes misses on the high side (predicting a still-swift but not quite Adam Peatty-esque 58.82 in the men’s 100 breast) and sometimes misses on the low side (a rather unlikely 3:36.88 in the men’s 400 free), but usually does pretty well. Of the 28 events, 21 have R-squareds of at least 98% and 9 are at least 99%.
But the most intriguing event for me personally is in the women’s 800 Free. After the men’s 400, this is the second most aggressive modeled prediction for the world record come Rio. It is intriguing for its prediction (an 8:03.85 which is both completely unbelievable and yet strangely believable at the same time), its goodness of fit (an R-squared of 99.2%) and what the data itself look like.
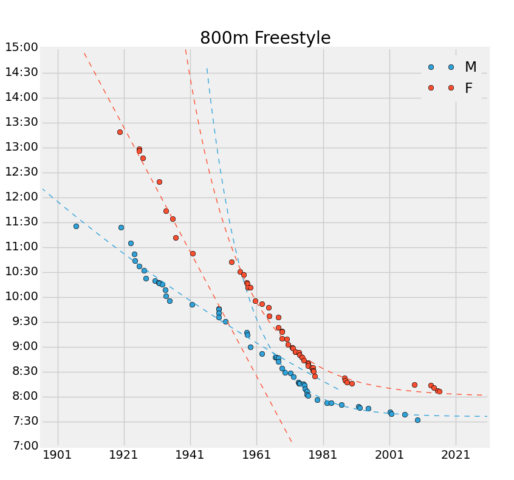
I have no explanation for this at all. But it’s pretty awesome. Which, fittingly, describes how I feel about Katie Ledecky.
This article is written by Barry Revzin with help from Jennifer La’O:
Agreed, this kind of stuff is super interesting. I agree with what Kirk said about other events.
MOAR NUMBERS.
This is great – I hope swimswam continues to have articles on swimming statistics in the future.
Great article! Would be interesting to see this analysis for multiple other events and look any differences in decay rates among them.