This article is number six in the series looking at how the times at the conference level have been changing in the last five years (2020-2024) for the Power 5 conferences and the Ivy League. It’s felt like times required to qualify, final and win have been coming down considerably recently, but how much does the data back this up?
We’ll be including the Pac-12, even though the conference swim & dive championships no longer exist.
- SEC Men’s
- SEC Women’s
- ACC Men’s
- ACC Women’s
- Pac-12 Men’s
- Pac-12 Women’s
- Big Ten Men’s
- Big Ten Women’s
- Big 12
- Ivy League
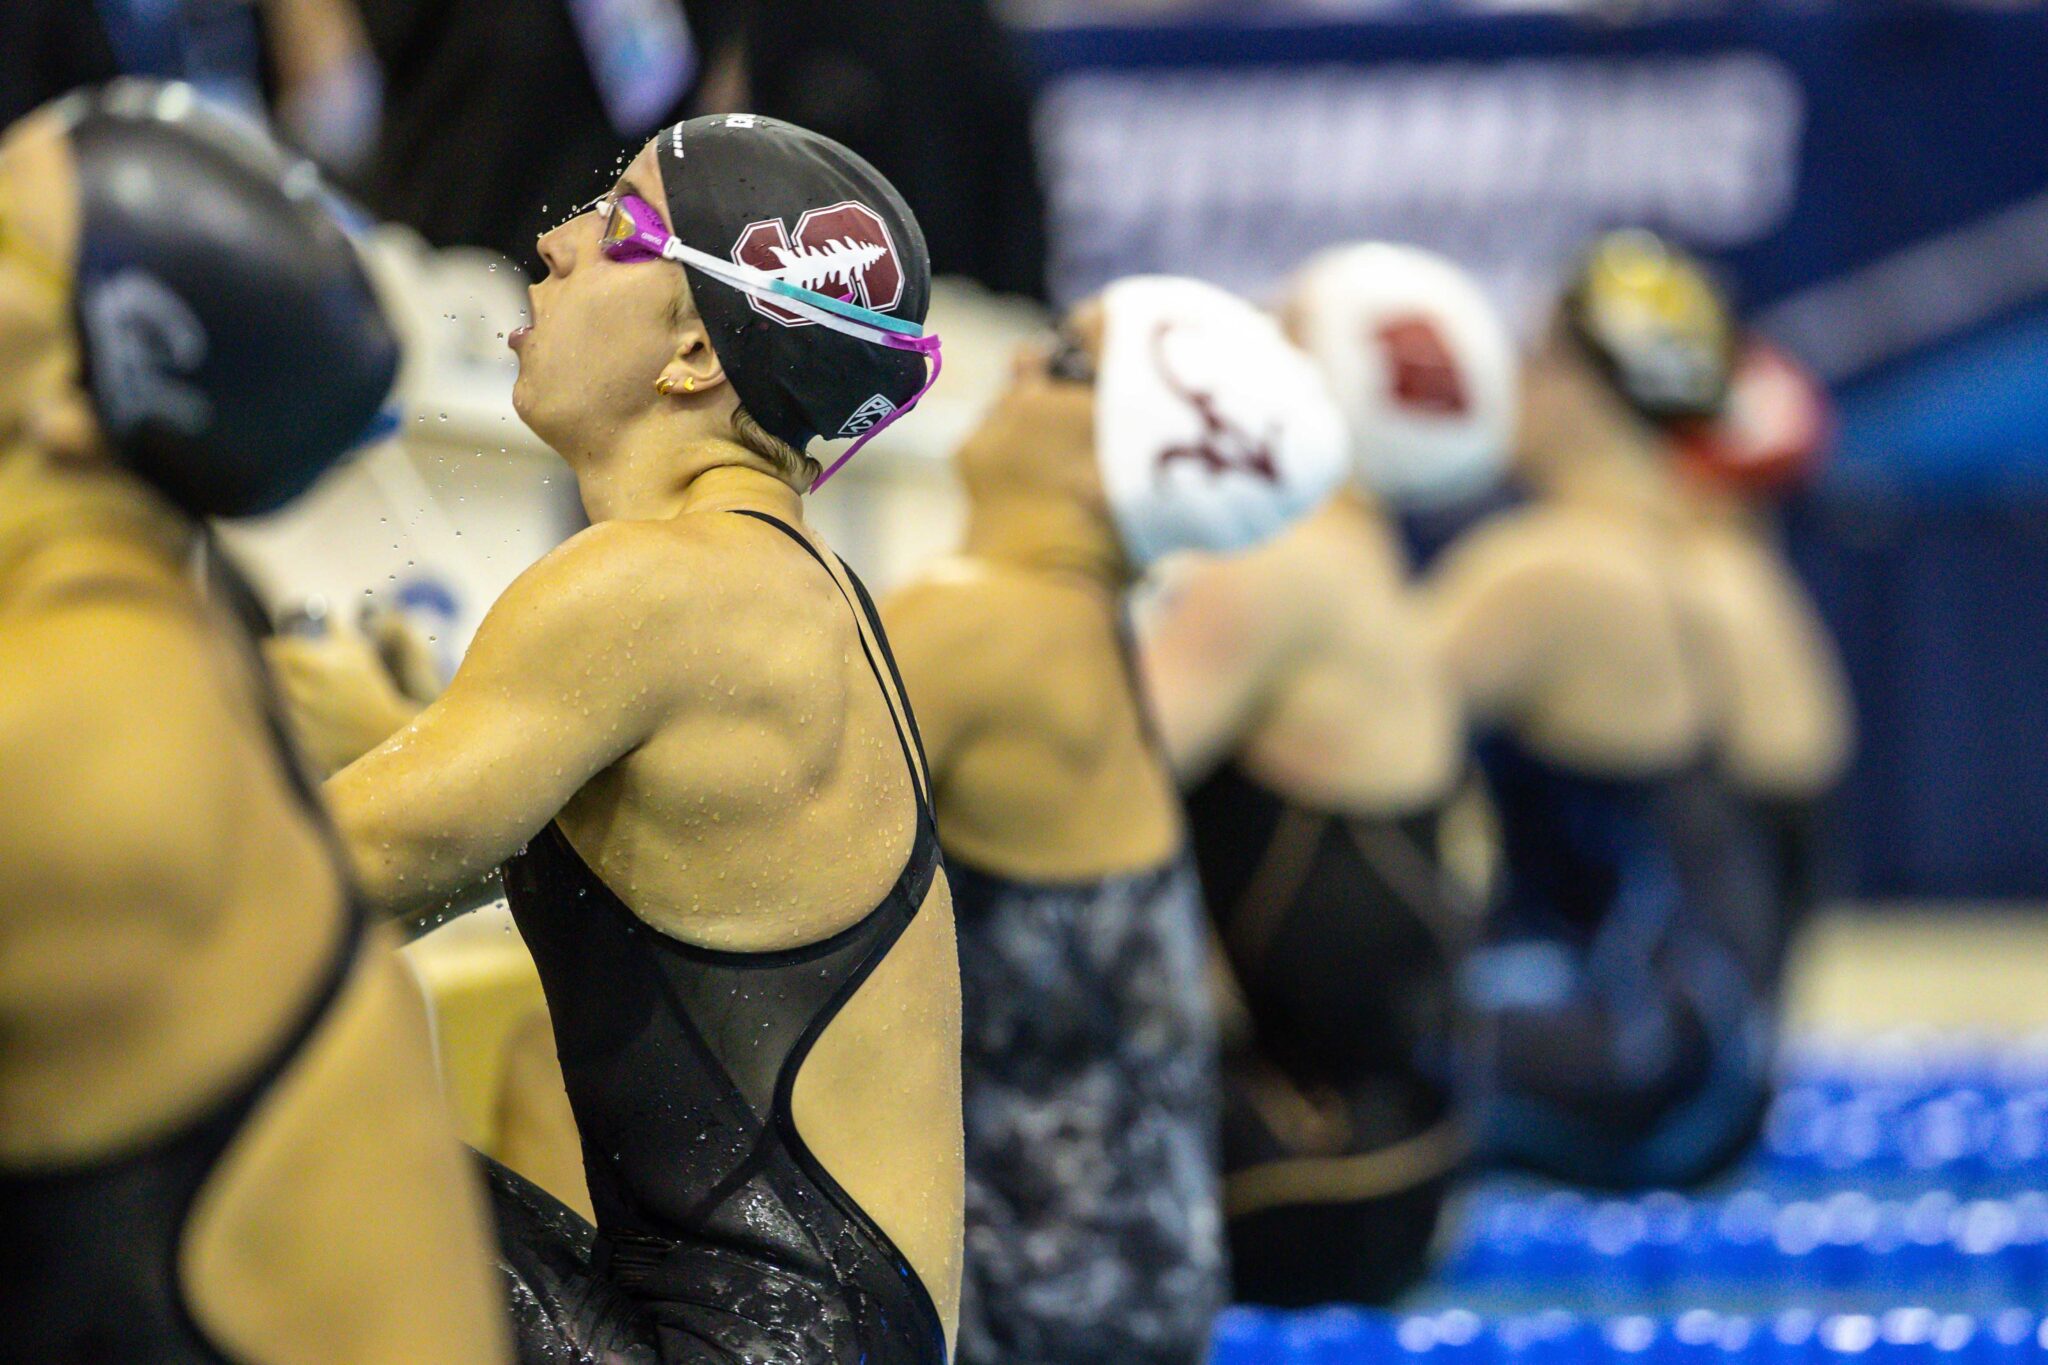
For a second time, we’re looking backward rather than toward the future. Cal were champions in the final Pac-12 championships, with Stanford somewhat surprisingly being edged out by a resurgent USC into third. It’ll all change this year though in the teams’ new conferences, and Stanford is on a bit of a tear so far this season – they have nation-leading times in seven events. They’ll all likely be eager to hit the ground running though, especially as several of the old rivalries continue. We saw a fairly quick championship last year – a majority of events were at least slightly faster than in 2023 – and based on both that and the times we’ve seen so far this season they’ll be competitive in a big way over the next few weeks.
WHAT DATA ARE WE LOOKING AT?
We’ll look at the times required individually to make ‘A’ (8th), ‘B’ (16th) and ‘C’ (24th) finals (where they exist), as well as the winning time for each year. For relays, we’ll choose to look at 1st, 3rd and 8th. If there were fewer than eight teams competing, we would just take the times from 1st and 3rd. Other than the winning individual time, these will all be from heats.
WHAT ARE WE INTERESTED IN?
Have the times got faster, and is there a definitive trend in the times? The first of these is simple to work out – were last year’s times faster than in 2020 – but the second is a little trickier. How do we judge what is significant and what is maybe due to a single swimmer, à la Leon Marchand? To make this decision, we make use of something known as correlation- essentially how much of a link is there between two separate variables. In our case the two variables are the year and the finishing time for each position.
A QUICK STATISTICS REFRESHER
The R-value is the measure of correlation and can take a value between -1 and 1. To get a sense of what an R-value means, there are three important values:
- An R-value of 1 would indicate that there is a perfectly linear positive relationship between the two (eg. each year the winning time increases by 0.5),
- An R-value of -1 would indicate a perfectly linear negative relationship (eg. each year the winning time decreases by 0.5).
- An R-value of 0 indicates that there is no relationship between the two – the winning time does not depend on the year at all.
Think about plotting the data on a graph of year against time and drawing a best-fit line through the points. The closer the points are to that line, the more correlated the data and the higher the R-value.
WHAT MAKES AN R-VALUE SIGNIFICANT?
With the data we’re choosing to look at, an R-value is only significant if it is either greater than 0.805 or less than -0.805. That is a pretty high threshold, and we’ll see that for some events and placings there’s a strong trend that doesn’t quite hit this.
So what does significant mean? In this context, it means that we can say that there is an extremely strong trend in the times for this event and placement getting faster – and that it’s happening every year. A winning time that has a general downward trend but fluctuates pretty wildly year on year will have an R-value closer to zero than an event that gets faster at a slower rate, but gets faster every time.
The R-value in this case is a measure of consistency – how confident we are that this is a real trend and not just noise in the data. The significance level (0.805) is our confidence threshold in this.
Because the significance threshold is so high, we’ll also define another – a Strong threshold. We’ll set this to be when the R-value is greater than 0.5 or less than -0.5. Anything between these two values we’ll call Weak.
AN OVERVIEW
Of the 55 event/position combinations, 37 have been trending faster over the last 5 years.
| Significant Trend Faster | Strong Trend Faster | Weak Trend Faster |
| 3 | 19 | 15 |
Forty-five combinations were faster last year than in 2020 as well. The strongest improvements have probably come in butterfly: Last year’s ‘A’ final time would have been just over half a second off scoring at NCAAs, and the 100 has a fair amount of depth behind the Olympians at the top. The trends aren’t particularly strong, but the improvements are widespread. The later date of the championships compared to SECs and ACCs is a likely reason – pulling a double taper is more risky when there are only three weeks between the meets.
FREESTYLE
| Position | 2020 | 2021 | 2022 | 2023 | 2024 | Net Change | R-Value | Trend | |
| 50 Fr | 1 | 21.03 | 22.18 | 21.89 | 21.67 | 21.95 | 0.92 | 0.480 | Weak |
| 8 | 22.26 | 22.43 | 22.30 | 22.41 | 22.39 | 0.13 | 0.513 | Strong | |
| 16 | 22.75 | 22.77 | 22.55 | 22.69 | 22.61 | -0.14 | -0.611 | Strong | |
| 24 | 23.01 | 23.16 | 22.75 | 22.99 | 22.85 | -0.16 | -0.492 | Weak | |
| 100 Fr | 1 | 47.85 | 47.54 | 47.07 | 47.18 | 47.69 | -0.16 | -0.324 | Weak |
| 8 | 48.93 | 48.95 | 48.74 | 48.92 | 48.73 | -0.20 | -0.622 | Strong | |
| 16 | 49.28 | 49.38 | 49.12 | 49.38 | 49.05 | -0.23 | -0.481 | Weak | |
| 24 | 49.77 | 50.19 | 49.67 | 49.78 | 49.58 | -0.19 | -0.534 | Strong | |
| 200 Fr | 1 | 1:42.47 | 1:43.40 | 1:42.29 | 1:43.04 | 1:42.42 | -0.05 | -0.153 | Weak |
| 8 | 1:45.06 | 1:47.23 | 1:46.50 | 1:45.37 | 1:45.37 | 0.31 | -0.213 | Weak | |
| 16 | 1:47.81 | 1:50.41 | 1:47.57 | 1:47.23 | 1:46.43 | -1.38 | -0.625 | Strong | |
| 24 | 1:48.79 | 1:52.43 | 1:48.51 | 1:48.59 | 1:48.26 | -0.53 | -0.442 | Weak |
The top of the 50 has slowed down, which we can attribute to the graduation of Abbey Weitzeil in 2020, but elsewhere the conference was getting quicker. The decreases aren’t huge, but they’re consistent across distances and positions. There’s been a lot of turnover on the podium as well – there have been nine different winners across these three events, and only four multi-time champions: Torri Huske, Anicka Delgado, Laticia Transom and Minna Abraham.
| Position | 2020 | 2021 | 2022 | 2023 | 2024 | Net Change | R-Value | Trend | |
| 500 Fr | 1 | 4:33.74 | 4:37.07 | 4:38.80 | 4:38.29 | 4:35.05 | 1.31 | 0.282 | Weak |
| 8 | 4:39.36 | 4:46.41 | 4:44.56 | 4:43.48 | 4:42.97 | 3.61 | 0.262 | Weak | |
| 16 | 4:44.16 | 4:54.10 | 4:50.89 | 4:48.87 | 4:48.67 | 4.51 | 0.165 | Weak | |
| 24 | 4:49.24 | 4:58.39 | 4:52.50 | 4:52.66 | 4:51.94 | 2.70 | -0.016 | Weak | |
| 1650 Fr | 1 | 15:50.81 | 16:03.27 | 15:48.69 | 16:02.28 | 15:46.35 | -4.46 | -0.198 | Weak |
| 8 | 16:23.19 | 16:48.11 | 16:21.45 | 16:32.40 | 16:30.34 | 7.15 | -0.021 | Weak |
The 500 has followed the trends we’ve seen across the NCAA, slowing down in 2021/22 before accelerating back down again. The times are all slower than back in 2020, but all faster than last year, and exposing our small sample size these events have all been trending downwards sharply since 2021 – come this year a five-year analysis would likely have some strong trends. The 1650 has been a little more inconsistent, and whilst Aurora Roghair is already 10 seconds faster this season than last year’s winning time there are only four women from the conference under the 16:30 that scored double digits in 2024.
BACKSTROKE
| Position | 2020 | 2021 | 2022 | 2023 | 2024 | Net Change | R-Value | Trend | |
| 100 BK | 1 | 51.06 | 51.13 | 49.50 | 49.46 | 50.39 | -0.67 | -0.588 | Strong |
| 8 | 53.11 | 53.47 | 53.07 | 52.95 | 53.59 | 0.48 | 0.252 | Weak | |
| 16 | 54.41 | 55.20 | 54.09 | 54.24 | 54.50 | 0.09 | -0.288 | Weak | |
| 24 | 55.46 | 58.93 | 55.45 | 55.02 | 55.43 | -0.03 | -0.388 | Weak | |
| 200 BK | 1 | 1:51.37 | 1:50.83 | 1:49.51 | 1:47.43 | 1:50.16 | -1.21 | -0.602 | Strong |
| 8 | 1:55.01 | 1:56.54 | 1:54.98 | 1:54.84 | 1:56.52 | 1.51 | 0.239 | Weak | |
| 16 | 1:56.69 | 1:59.15 | 1:56.93 | 1:57.17 | 1:57.92 | 1.23 | 0.076 | Weak | |
| 24 | 1:59.82 | 2:03.40 | 1:58.60 | 1:59.02 | 2:00.09 | 0.27 | -0.321 | Weak |
Claire Curzan and Regan Smith caused big drops in the winning times, but there hasn’t been too much of a push on the times further down. there have been other strong contenders near the top – Isabel Ivey., Isabelle Stadden and Taylor Ruck – the 100 has stayed relatively stable at all three final times, and the 200 has gotten a little slower – not strongly, but enough to be noticeable in the net time change.
BREASTSTROKE
| Position | 2020 | 2021 | 2022 | 2023 | 2024 | Net Change | R-Value | Trend | |
| 100 Br | 1 | 59.35 | 57.85 | 57.31 | 57.10 | 57.51 | -1.84 | -0.781 | Strong |
| 8 | 1:00.57 | 1:01.16 | 1:00.50 | 1:00.92 | 1:00.54 | -0.03 | -0.164 | Weak | |
| 16 | 1:01.85 | 1:03.13 | 1:02.43 | 1:02.19 | 1:01.15 | -0.70 | -0.507 | Strong | |
| 24 | 1:03.28 | 1:05.73 | 1:03.66 | 1:02.51 | 1:02.30 | -0.98 | -0.599 | Strong | |
| 200 Br | 1 | 2:07.35 | 2:06.53 | 2:06.42 | 2:05.66 | 2:06.58 | -0.77 | -0.635 | Strong |
| 8 | 2:12.01 | 2:13.11 | 2:12.54 | 2:13.15 | 2:11.87 | -0.14 | -0.064 | Weak | |
| 16 | 2:15.75 | 2:19.22 | 2:15.36 | 2:14.47 | 2:14.11 | -1.64 | -0.624 | Strong |
The trend in winning time for the 100 is down to one woman – Kaitlyn Dobler. She won the final four titles in the 100, all sub-58, and also claimed the NCAA title in 2022. She drove a trend in the 200 as well, winner in three of those years with Isabelle Odgers winning the other, but every single one of the combinations was faster in 2024 – it was not only getting faster at the top.
FLY
| Position | 2020 | 2021 | 2022 | 2023 | 2024 | Net Change | R-value | Trend | |
| 100 Fly | 1 | 49.94 | 50.87 | 49.43 | 49.27 | 50.89 | 0.95 | 0.062 | Weak |
| 8 | 52.92 | 52.71 | 52.50 | 52.82 | 52.19 | -0.73 | -0.735 | Strong | |
| 16 | 54.31 | 54.01 | 53.58 | 53.63 | 53.48 | -0.83 | -0.927 | Significant | |
| 24 | 55.35 | 55.58 | 54.84 | 54.92 | 54.22 | -1.13 | -0.881 | Significant | |
| 200 Fly | 1 | 1:51.26 | 1:52.82 | 1:50.99 | 1:52.68 | 1:51.74 | 0.48 | 0.157 | Weak |
| 8 | 1:57.57 | 2:00.91 | 1:57.64 | 1:56.39 | 1:55.56 | -2.01 | -0.663 | Strong | |
| 16 | 2:00.89 | 2:05.60 | 2:01.97 | 2:01.73 | 1:59.53 | -1.36 | -0.462 | Weak |
Fluctuations at the top, steady(ish) improvement in the finals times. World and Olympic champion Torri Huske won in 49-lows in 2022 and 2023, and her Olympic redshirt last year exposed the drop off to second: we saw the same in 2021 after Louise Hansson’s graduation. Like the backstrokes, there’s strength right at the top that doesn’t lend itself to steady improvement. The times to make the final have improved a lot though, especially in the 100, and the times in 8th and 16th so far this year from teams from the conference put them right in line with last year’s, which were already a big drop. The 200 is a little more uneven, but that ‘A’ final time would have qualified for NCAAs last year and is only just outside the top-8 in the ACC in 2024/25.
IM
| Position | 2020 | 2021 | 2022 | 2023 | 2024 | Net Change | R-value | Trend | |
| 200 IM | 1 | 1:54.09 | 1:53.65 | 1:52.42 | 1:54.02 | 1:53.31 | -0.78 | -0.277 | Weak |
| 8 | 1:58.31 | 1:59.29 | 1:57.75 | 1:58.31 | 1:57.72 | -0.59 | -0.537 | Strong | |
| 16 | 2:00.05 | 2:01.87 | 1:59.83 | 2:00.12 | 1:59.34 | -0.71 | -0.522 | Strong | |
| 24 | 2:01.54 | 2:04.54 | 2:00.93 | 2:01.63 | 2:01.43 | -0.11 | -0.344 | Weak | |
| 400 IM | 1 | 4:01.53 | 4:02.57 | 4:00.76 | 4:05.27 | 4:02.32 | 0.79 | 0.396 | Weak |
| 8 | 4:14.00 | 4:15.68 | 4:15.41 | 4:12.89 | 4:10.98 | -3.02 | -0.722 | Strong | |
| 16 | 4:19.68 | 4:28.61 | 4:18.49 | 4:19.26 | 4:16.50 | -3.18 | -0.530 | Strong |
Stanford has had strong IMers in the past, Ella Eastin and Katie Ledecky being NCAA record holders in the 400 IM at different points, and is still strong in this area. Torri Huske, Caroline Bricker and Lucy Bell are all recent NCAA A-finalists, and Huske and Bricker are previous Pac-12 IM champions as well. ‘A’ final times in the 400 had dropped drastically in the past two years, but they’d crept down a little slower in the 200.
RELAYS
*There have been some big DQs at Pac-12s, and in relays these can have an outsized effect on the trends. Therefore we’ve included the times of DQ’ed teams
| Position | 2020 | 2021 | 2022 | 2023 | 2024 | Net Change | R-value | Trend | |
| 200 FR | 1 | 1:27.22 | 1:26.84 | 1:26.52 | 1:25.98 | 1:27.10 | -0.12 | -0.349 | Weak |
| 3 | 1:28.44 | 1:28.42 | 1:28.02 | 1:28.19 | 1:28.05 | -0.39 | -0.803 | Strong | |
| 400 FR | 1 | 3:10.76 | 3:11.27 | 3:09.06 | 3:08.83 | 3:11.09 | 0.33 | -0.242 | Weak |
| 3 | 3:13.22 | 3:15.28 | 3:12.41 | 3:14.12 | 3:12.27 | -0.95 | -0.385 | Weak | |
| 800 FR | 1 | 6:54.91 | 6:55.99 | 6:50.21 | 6:53.90 | 6:53.33 | -1.58 | -0.380 | Weak |
| 3 | 6:56.88 | 7:05.32 | 7:03.49 | 7:02.70 | 6:58.41 | 1.53 | 0.020 | Weak | |
| 200 MED | 1 | 1:35.93 | 1:35.18 | 1:34.68 | 1:35.40 | 1:33.89 | -2.04 | -0.789 | Strong |
| 3 | 1:36.90 | 1:37.06 | 1:36.09 | 1:35.63 | 1:35.67 | -1.23 | -0.911 | Significant | |
| 400 MED | 1 | 3:27.26 | 3:26.70 | 3:25.54 | 3:25.79 | 3:27.28 | 0.02 | -0.169 | Weak |
| 3 | 3:31.58 | 3:33.86 | 3:29.68 | 3:31.10 | 3:31.64 | 0.06 | -0.278 | Weak |
The relays have jumped around a bit, with only the 200 medley noticeably coming down. We’re essentially tracking just three colleges here – Stanford, Cal and USC have taken the podium position in nearly every one of these relays. Arizona State has become more competitive in the last two years, taking third in 2024 in the 800 free relay, but the improvements we see are from the teams fighting it out for the championship.
IN SUMMARY
The women’s Pac-12 had been one of the more stable championships over the last five years – there are very few trends significantly faster.
Whilst they’ll all bring positives to their new conferences, there’ll be somewhat of a shake-up for most of the teams. Stanford and Cal will no longer be the big fish, fighting for second behind the Cavalier juggernaut with Louisville and NC State, but Arizona State will become just that in the Big 12. Arizona will also be near the top in that conference, whereas USC will go into a competitive Big Ten. Whilst Indiana are the favorites there they’ll be in a fight with Ohio State, Michigan and Wisconsin for second. We might see the Pac-12 teams approach their new conference championships slightly differently, but they’ll certainly be finishing up near the top of them.