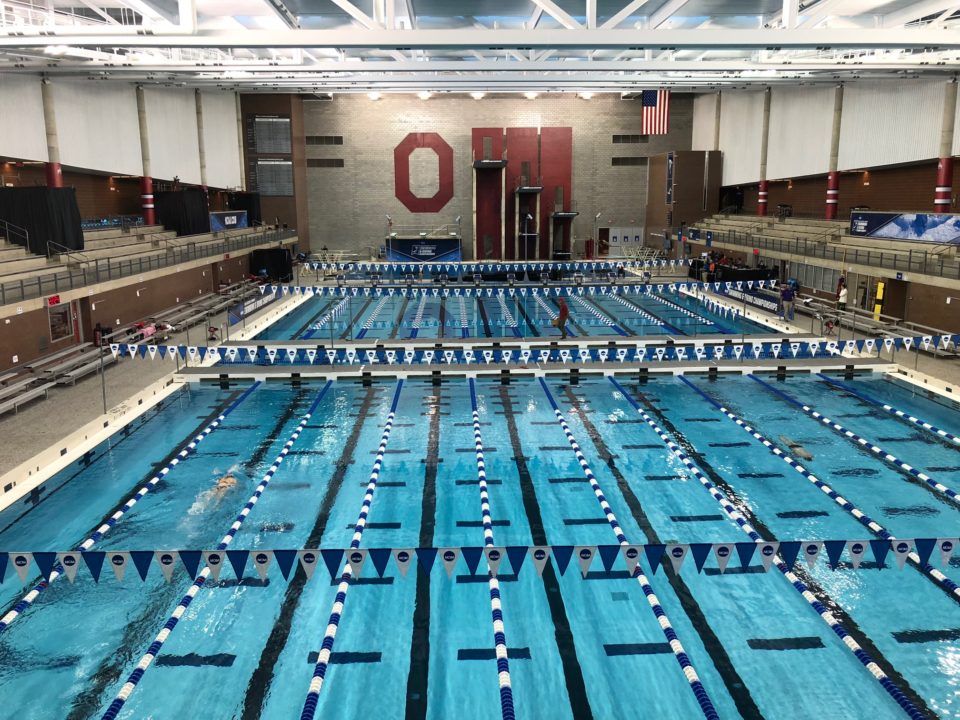
It’s always hard to qualify for the NCAA Championships in an individual race. In fact, out of the thousands of NCAA Division I swimmers, only 516 (235 men, 281 women) earn the right to swim individually at the NCAA Championships.
If we use “getting faster” as a synonym for “getting harder,” then it tends to “get harder” every year to make the NCAA Championships, but not necessarily in every event. For example, there were 3 events this year where the slowest invited time was actually slower than it was in 2017: the men’s 200 free (.24 seconds slower), the men’s 100 breast (.13 seconds slower), and the women’s 50 free (.07 seconds slower). In fact, in the men’s 200 free, the last 6 qualifiers this year wouldn’t have been under the invite line last year. In the men’s 100 breaststroke, that number is 5, and in the women’s 50 free, the last 9 would not have broken the invite line (including a 4-way tie for the last qualifying spot).
Other events got much harder, especially the 1650 freestyles. Specifically, the men’s race invite time went from 14:56.84 to 14:53.34, which is a .39% improvement. Interestingly, the men’s 500 free invite time only dropped by .22%.
The women’s 1650 free saw a very-similar .40% drop in the invited time, while the women’s 500 got faster by .48%.
The charts below show the historical invite times over the last 4 years. The big anomaly is the 2016 meet, where most of the men’s invite times got slower, which can probably be chalked up to the pull of the pending Olympic Trials (either from redshirts, or from a shift in focus toward long course).
Men
| Event | 2015 Invite Time | 2016 Invite Time | 2017 Invite Time | 2018 Invite Time |
| 50 free | 19.52 | 19.53 | 19.43 | 19.36 |
| 100 free | 42.94 | 43.05 | 42.76 | 42.71 |
| 200 free | 1:34.54 | 1:34.67 | 1:34.20 | 1:34.44 |
| 500 free | 4:17.15 | 4:17.73 | 4:16.67 | 4:16.08 |
| 1650 free | 14:59.20 | 15:00.11 | 14:56.84 | 14:53.34 |
| 100 fly | 46.38 | 46.44 | 46.10 | 45.89 |
| 200 fly | 1:43.74 | 1:43.65 | 1:43.09 | 1:42.52 |
| 100 back | 46.46 | 46.51 | 46.28 | 46.14 |
| 200 back | 1:42.04 | 1:41.92 | 1:41.74 | 1:41.18 |
| 100 breast | 52.97 | 52.92 | 52.62 | 52.75 |
| 200 breast | 1:55.04 | 1:55.31 | 1:54.54 | 1:54.49 |
| 200 IM | 1:44.58 | 1:44.41 | 1:44.34 | 1:44.03 |
| 400 IM | 3:45.34 | 3:45.61 | 3:44.92 | 3:43.89 |
Women
| Event | 2015 Invite Time | 2016 Invite Time | 2017 Invite Time | 2018 Invite Time |
| 50 free | 22.40 | 22.35 | 22.23 | 22.30 |
| 100 free | 48.89 | 48.77 | 48.62 | 48.53 |
| 200 free | 1:45.95 | 1:45.84 | 1:45.44 | 1:44.90 |
| 500 free | 4:43.01 | 4:42.69 | 4:41.84 | 4:40.50 |
| 1650 free | 16:17.36 | 16:17.64 | 16:16.41 | 16:12.53 |
| 100 fly | 52.79 | 52.77 | 52.52 | 52.41 |
| 200 fly | 1:56.97 | 1:57.02 | 1:56.60 | 1:55.99 |
| 100 back | 52.97 | 52.93 | 52.65 | 52.54 |
| 200 back | 1:54.66 | 1:54.47 | 1:54.00 | 1:53.64 |
| 100 breast | 1:00.74 | 1:00.66 | 1:00.34 | 1:00.11 |
| 200 breast | 2:11.23 | 2:10.89 | 2:10:55 | 2:10.14 |
| 200 IM | 1:58.13 | 1:57.90 | 1:57.66 | 1:56.76 |
| 400 IM | 4:12.31 | 4:11.05 | 4:10.86 | 4:09.75 |

The women’s 50 is slower than last year? Wild!
Here is my non-math analytics. It got harder and swimming is fast
Crazy to think how women’s breaststroke will be under 1:00 & 2:10 next year!! ?
The men’s 200 fly and 200 back are dropping steadily. That 1:42.5 just to qualify will take a full taper for most flyers.
Patrick O’Neil from Cal won the 200 fly back in 2007 in 1:42.98. He wouldn’t have even qualified for the meet this year.
Ehhh not necessarily true. His time would not have, but if you place him on Cal this year and he does this year’s training, I’m betting he would. I mean, he was the BEST 200 flyer in NCAA that year.